Last updated: May 31, 2026 at 03:38 AM ET
Current System — Full Stats
60
Total Trades
40%
Win Rate
-3.9R
Cumulative R
-0.07R
Avg R / Trade
11.3R
Max Drawdown
+3.0R
Best Day
Equity Curve — Current System
Only trades from the current, fully refined algorithm.
Before vs. After
Early versions had bugs that let bad trades through. Same strategy, same market — the only change was fixing the code.
Early Dev
62
Trades
31%
Win Rate
-15.7R
Result
Current System
60
Trades
40%
Win Rate
-3.9R
Result
Equity Curve — All Trades
The full journey — all 122 trades including early development.
Weekly Summary
| Week | Trades | W / L | Result |
|---|---|---|---|
| 2026-05-18 — 2026-05-22 | 8 | 1W / 6L | -4.3R |
| 2026-05-11 — 2026-05-15 | 1 | 0W / 1L | -1.1R |
| 2026-05-04 — 2026-05-08 | 4 | 1W / 1L | +0.3R |
| 2026-04-27 — 2026-05-01 | 8 | 1W / 6L | -2.3R |
| 2026-04-20 — 2026-04-24 | 8 | 2W / 6L | -4.0R |
| 2026-04-13 — 2026-04-17 | 4 | 3W / 0L | +3.1R |
| 2026-04-06 — 2026-04-10 | 3 | 2W / 1L | +2.6R |
| 2026-03-30 — 2026-04-03 | 2 | 1W / 1L | +0.1R |
Recent Days
| Date | Trades | W / L | Result |
|---|---|---|---|
| 2026-05-22 | 1 | 0W / 0L | +0.0R |
| 2026-05-21 | 2 | 0W / 2L | -2.0R |
| 2026-05-20 | 1 | 0W / 1L | -1.0R |
| 2026-05-19 | 1 | 1W / 0L | +1.8R |
| 2026-05-18 | 3 | 0W / 3L | -3.0R |
| 2026-05-14 | 1 | 0W / 1L | -1.1R |
| 2026-05-05 | 3 | 1W / 1L | +0.3R |
| 2026-05-04 | 1 | 0W / 0L | +0.0R |
| 2026-05-01 | 1 | 0W / 1L | -1.0R |
| 2026-04-30 | 5 | 1W / 3L | -0.1R |
| 2026-04-29 | 2 | 0W / 2L | -1.2R |
| 2026-04-24 | 1 | 0W / 1L | -1.0R |
| 2026-04-23 | 3 | 2W / 1L | +1.1R |
| 2026-04-22 | 1 | 0W / 1L | -1.0R |
| 2026-04-21 | 1 | 0W / 1L | -1.0R |
| 2026-04-20 | 2 | 0W / 2L | -2.0R |
| 2026-04-19 | 1 | 1W / 0L | +0.9R |
| 2026-04-17 | 2 | 2W / 0L | +2.3R |
| 2026-04-16 | 1 | 0W / 0L | +0.0R |
| 2026-04-07 | 3 | 2W / 1L | +2.6R |
Backtest — 1841+ Trades
Full backtest, Jan 2021 – Apr 2026 (5-year window). Front-month MES data. Commission and slippage included.
1841
Trades
40%
Win Rate
4.8%
Max Drawdown
+0.02R
Avg per Trade
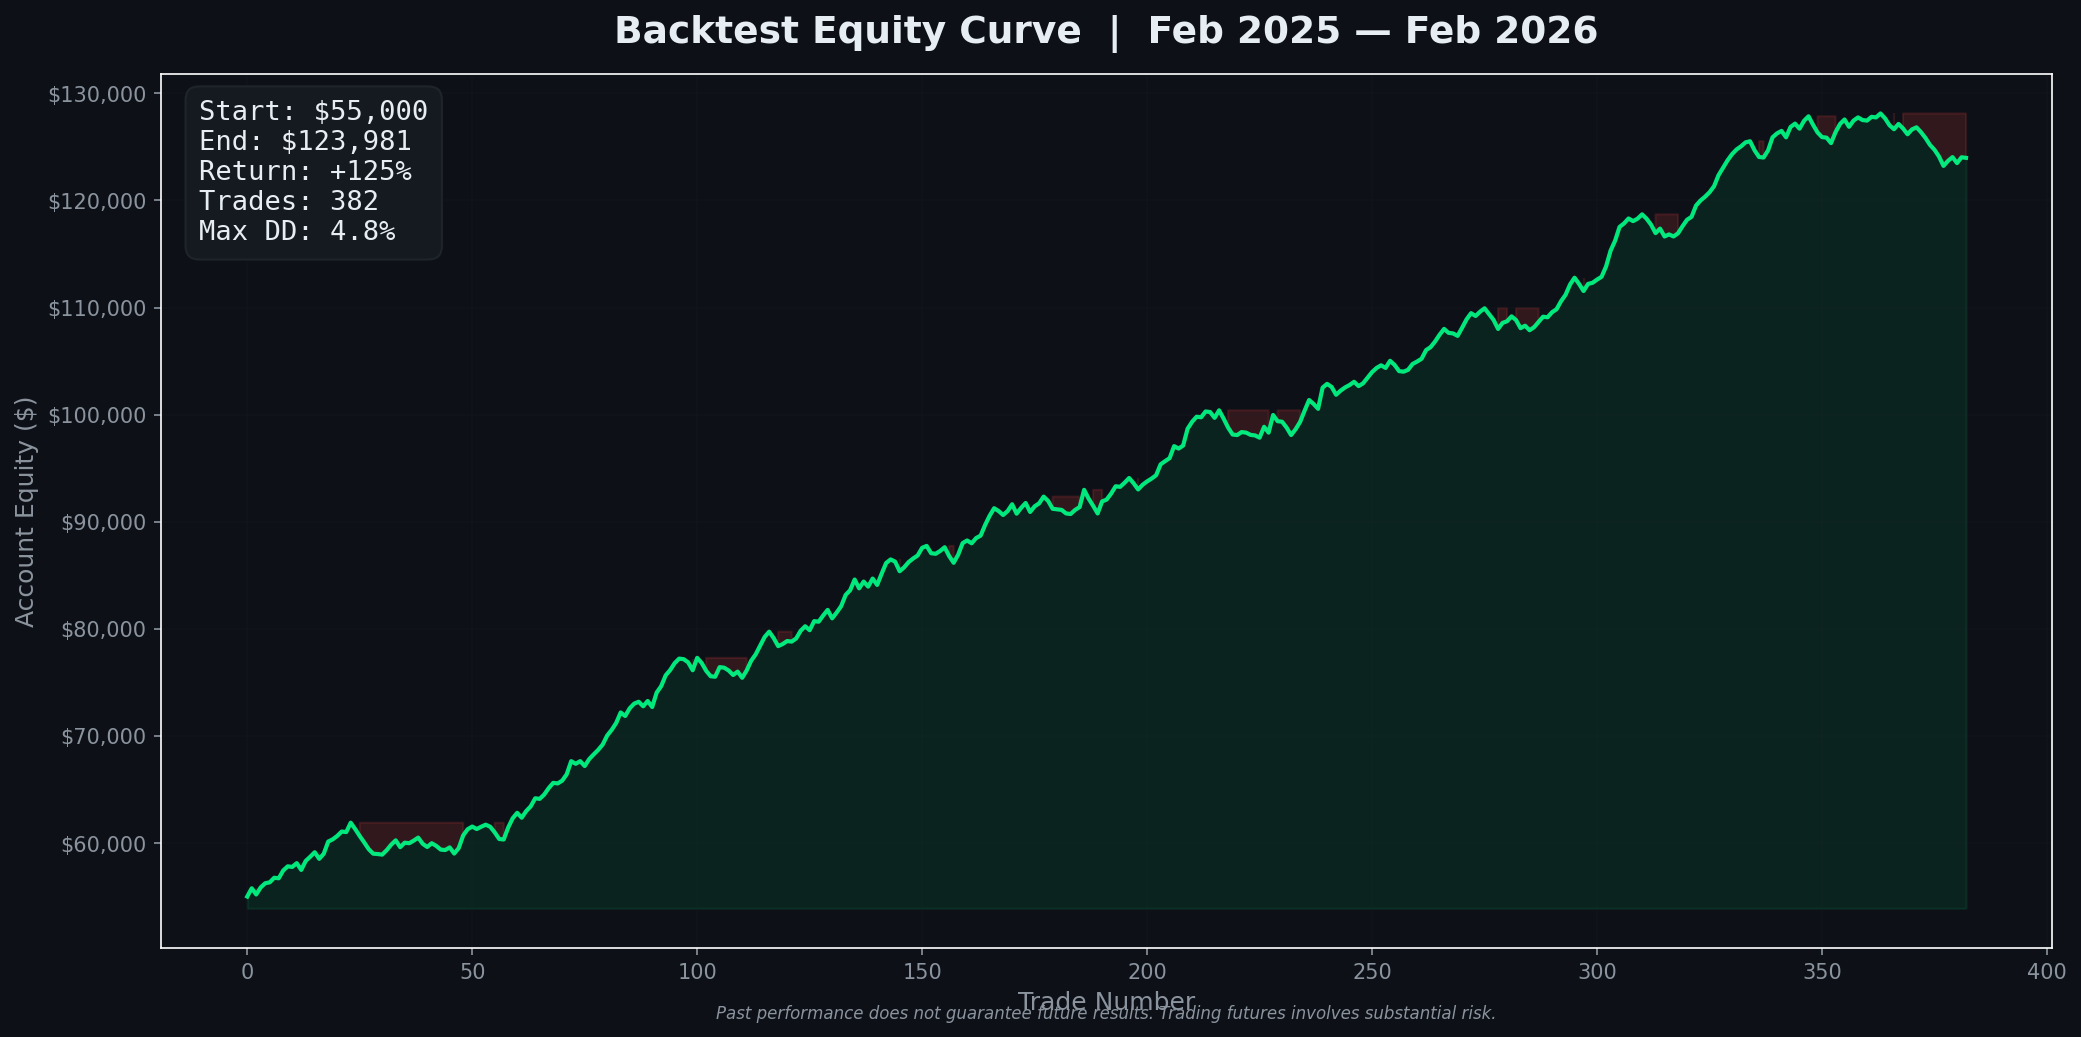
Past performance does not guarantee future results.